A new boiler fails the heating grid when the worst pipe still loses 27 percent of heat sales, and the same outage stops pumped water when available power sits under the winter peak. RDNA4, covering 24 February 2022 through 31 December 2024, estimates energy damage at US$20.51 billion and district-heating damage above US$2.5 billion inside that total. Water supply and sanitation damage is a separate US$4.6 billion. The infrastructure recovery guide already treats electricity as a condition for water and heat. This page is the grid that uses that electricity.
The asset and the service are different records
| Record | What it prints | Dominant failure mode | Prevention |
|---|---|---|---|
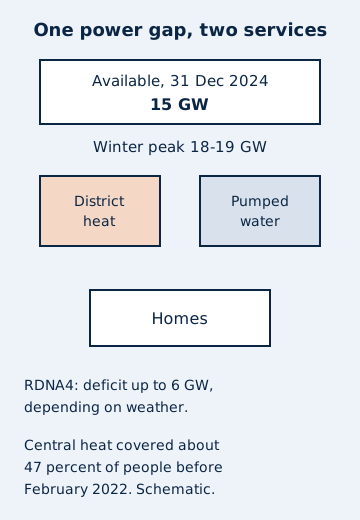
| RDNA4 energy chapter, damage as of 31 December 2024 | Energy damage US$20.51 billion. District heating estimated to exceed US$2.5 billion. Available capacity 15 GW. Winter peak 18–19 GW. Deficit up to 6 GW, depending on weather. Central heating covered about 47 percent of people before February 2022. | A boiler or a heat main is repaired, and the winter peak still exceeds available power. Heat and pumped water stop together. | Count the gigawatt gap with the heat and water jobs. The chapter says immediate outages disrupt both. |
| RDNA4 executive-summary footnote 16 | District heating, damage of US$2.5 billion, is in energy and extractives, as in RDNA1 and RDNA2. | Treating the footnote's US$2.5 billion and the chapter's "exceed US$2.5 billion" as one audited total. | Keep both sentences. Do not replace them with a single rounded figure. |
| RDNA4 water supply and sanitation chapter | Damage US$4.6 billion. About US$0.7 billion of that, an 18 percent increase from RDNA3, falls between 31 December 2023 and 31 December 2024. Losses US$12.7 billion. Needs US$11.3 billion for 2025–2035. | Calling the needs figure the damage figure, or the reverse. | Damage, loss, and needs are three columns in Table 31 and Table 32. |
| Same chapter, composition of damage | Wastewater treatment plants 28 percent. Wastewater networks 21 percent. Drinking-water networks 23 percent. | A plant is commissioned while the network that connects it is the broken asset. | 28 + 21 + 23 = 72 percent of the damage estimate is plants plus the two networks. Match the repair to the share. |
| PAD797 annex, 1 May 2014, Ivano-Frankivsk |
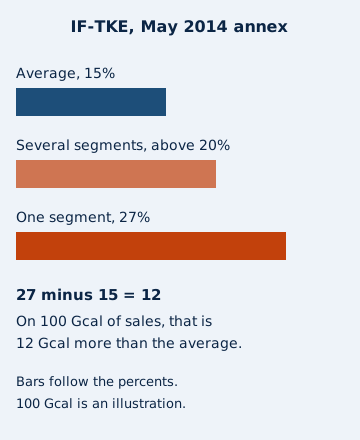
Network 130.7 km, diameters 25–600 mm. Average age 27 years. 67 percent of pipelines over 20 years old. Losses about 15 percent of heat sales, above 20 percent on several segments, 27 percent on one. | New boiler capacity feeds the 27 percent segment. Generation rises to cover the loss. | Replace the segment above 20 percent of heat sales before adding boilers. |
| PAD797 annex, Kherson |
Boiler efficiency 89 percent. Network 97 km in two-pipe equivalent. Pre-insulated pipe 4.6 percent of length. Estimated network losses 45,000 Gcal per year. | Reading the 4.6 percent share as a 2024 national stock. | It is one utility's 2014 length share. RDNA4 does not reprint it. |
The water chapter is explicit that the damage figures are indicative. They were extrapolated from the severity of fighting and from several sources, and the text says they can be an underestimate where oblasts are not accessible. This page uses the printed totals and does not tighten them.
Rules of thumb
Rule of thumb. If a heat-main segment’s reported loss is above 20 percent of heat sales, replace that segment before adding boiler capacity. In the May 2014 Ivano-Frankivsk annex, several segments were already above 20 percent and one reached 27 percent, against a network average of about 15 percent of heat sales. If available power is 15 GW and the winter peak is 18–19 GW, as RDNA4 records for 31 December 2024, a district-heating repair and a pumped-water repair share that gap. Do not schedule them as if the power system were already covering the peak.
Twelve extra gigacalories on an illustrative 100
The 2014 annex reports network losses as a percent of heat sales, not as a percent of generation. The comparison stays in that unit.
Extra loss versus the company average, on an illustrative 100 Gcal of sales:
(27 − 15) / 100 × 100 Gcal = 12 Gcal.
The 100 Gcal is not Ivano-Frankivsk’s annual sales. The annex sentence does not print annual sales next to the 27 percent. It prints the percentage. Twelve gigacalories is what that percentage gap is on 100 Gcal of sales. The same gap on any other sales total scales in a straight line: extra Gcal = sales × 0.12.
Khersonteploenerho’s annex line is a different unit. Estimated network losses are 45,000 Gcal per year, on a 97 km two-pipe network, with pre-insulated pipe at 4.6 percent of length. 100 − 4.6 = 95.4, so 95.4 percent of that length was not pre-insulated in the 2014 sheet. The annex does not assign the 45,000 Gcal to that 95.4 percent. The two numbers stay side by side. They are not divided into a loss per kilometre of old pipe, because the sheet does not say the new pipe has zero loss.
Water damage is not the heating damage
Water supply and sanitation damage of US$4.6 billion is not inside the US$2.5 billion heating line. Heating was moved into energy. Water remains its own chapter. Adding the two totals would invent a municipal sum the assessment does not print.
Of the US$4.6 billion, about US$0.7 billion is the increase from RDNA3 over the year ending 31 December 2024. The chapter calls that increase 18 percent. If the US$0.7 billion sits inside the US$4.6 billion, the earlier total is 4.6 − 0.7 = 3.9, and 0.7 / 3.9 = 0.179, which rounds to the printed 18 percent. The same US$0.7 billion is 0.7 / 4.6 = 0.152 of the cumulative total, about 15 percent. The 18 percent is the increase on the earlier total. The 15 percent is that year’s damage as a share of the cumulative total. The chapter does not print the RDNA3 dollar total on its own line.
The loss column is US$12.7 billion, up US$1.1 billion, or 10 percent, from February 2024. Around 21 percent of those losses is additional energy and fuel cost. 0.21 × 12.7 = 2.667, so about US$2.7 billion of the loss estimate is that energy category. Lost revenue is the larger slice, around 37 percent. 0.37 × 12.7 = 4.699, about US$4.7 billion. Those products are this page’s arithmetic on the chapter’s “around” shares. They are not extra lines in Table 31.
Pre-invasion access, in the same chapter: centralized piped water about 70 percent, centralized wastewater collection and treatment about 50 percent, and 10 million people without safely managed water. Urban piped access 80 percent, rural 34 percent. A repaired city plant does not close the rural gap. The WASH Cluster figure cited there, from the January 2025 humanitarian plan, is 8.5 million people in need of essential water and sanitation services. That is a needs count of people, not the US$11.3 billion reconstruction needs for 2025–2035.
The national economic regulator, the chapter says, oversees prices for water utilities serving more than 100,000 people. Tariffs for communal services were effectively frozen, with limited increases for commercial enterprises, and they have not followed the cost of providing the service. A network that is repaired and then unfunded for electricity is the failure the loss table already prices as energy cost. The funding guide is where procurement and financing records are separated from a service that is actually running.
A 2014 pipe is not a 2024 damage survey
The May 2014 appraisal is the engineering baseline for how these networks were built, not a measurement of war damage. Ivano-Frankivsk’s network in that annex is 130.7 km, with pipes from 25 mm to 600 mm, an average age of 27 years, and 67 percent of the pipelines already over 20 years old. About 28.6 km were estimated to need immediate replacement then. Linear heat load density was about 1.57 Gcal per hour per kilometre. Kherson’s was about 1.75. Those densities are the annex’s test of whether the network was economically attractive. They are not a 2024 load.
About 80,000 high-rise buildings, the appraisal’s main text says, consumed 44 percent of the country’s heat energy resources. The housing reconstruction guide is the building side of that load. A panel building that is not yet assessed is a poor place to hang a new heat connection. The pipe percentage and the building percentage answer different questions.
When this does not apply
- The project is a single facility generator with its own fuel, and the RDNA4 power gap is not the constraint. The 15 GW line is the national available capacity in that chapter. It is not the nameplate of one boiler house.
- The loss percentage comes from a utility other than the two in the 2014 annex. Kherson’s sheet prints 45,000 Gcal a year, not 15 percent of sales. Do not paste the Ivano-Frankivsk percentage onto it.
- The dollar figure is a contract value in a procurement system. RDNA4’s billions are assessment totals through 31 December 2024. The infrastructure guide points at DREAM for contract records. A contract amount is not Table 31.
- Someone adds US$2.5 billion of heating damage to US$4.6 billion of water damage and calls the sum municipal damage. Heating was classified into energy. Water has its own total.
Methods and sources
Energy damage, the district-heating bound, the 15 GW and 18–19 GW lines, the deficit of up to 6 GW, and the 47 percent central-heating penetration come from the RDNA4 energy chapter. The US$2.5 billion wording without “exceed” comes from executive-summary footnote 16. Water damage of US$4.6 billion, the US$0.7 billion increase, losses of US$12.7 billion, needs of US$11.3 billion, the 28, 21, and 23 percent damage shares, the access percentages, the 8.5 million people, and the tariff description come from the RDNA4 water supply and sanitation chapter. The assessment window is 24 February 2022 through 31 December 2024. Pipe lengths, ages, diameters, loss percentages, the 45,000 Gcal line, the 4.6 percent pre-insulated share, and the 80,000 high-rise sentence come from World Bank report PAD797, dated 1 May 2014. The 12 Gcal line and the US$2.7 billion and US$4.7 billion products are arithmetic on those printed figures. No city network was surveyed for this page.