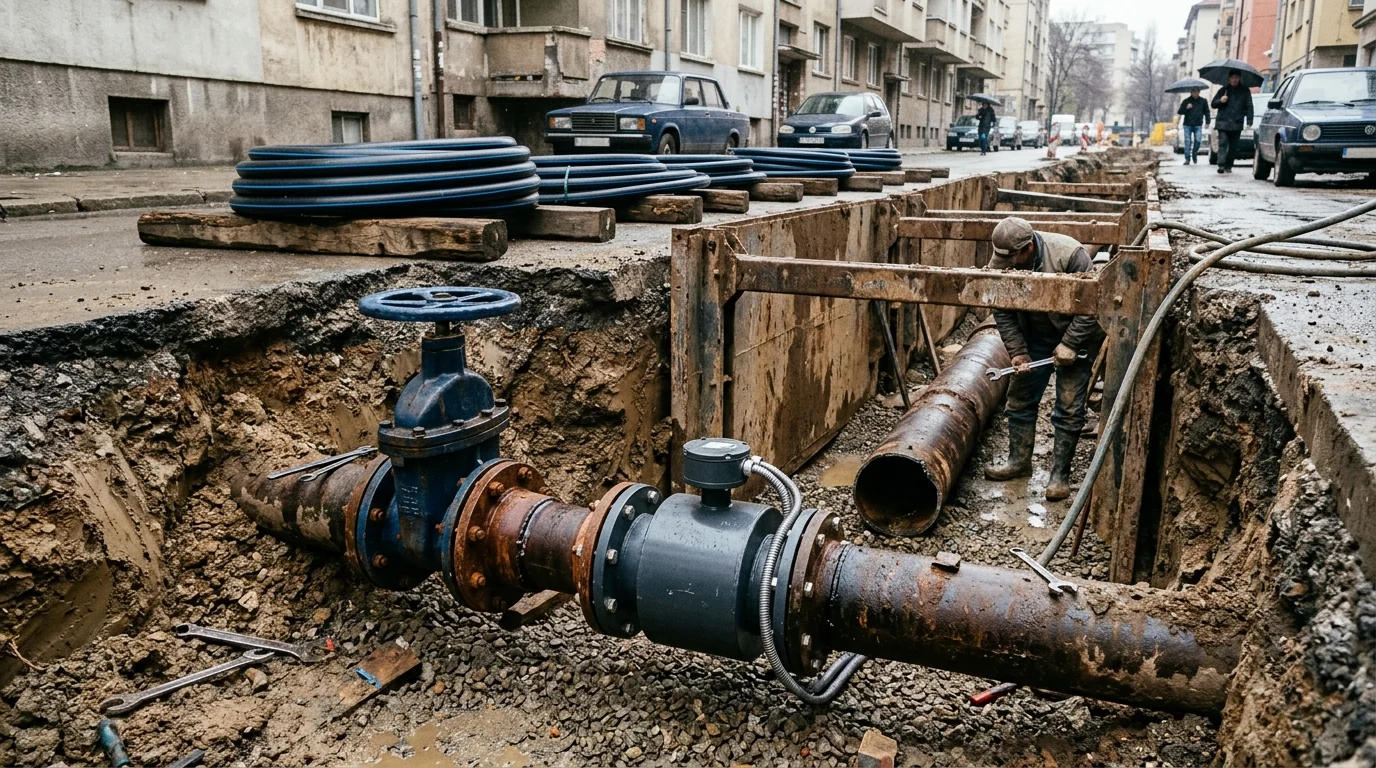
Restoring municipal water distribution after conflict damage requires utilities to transition from emergency pipe patching to systematic hydraulic auditing across Ukraine’s broader infrastructure recovery program and municipal water and heating grid rehabilitation. Approximately 40 percent of Ukraine’s existing water supply networks are assessed as being in a critical condition, and almost 35 percent of the water treatment facilities need rehabilitation or upgrade. In Ukraine, the national average level of water losses is estimated at about 36 percent, while the water metering level is around 60 percent, significantly below the average metering rate across the Danube region of 90 percent. Based on the Utility Performance Improvement Study covering 11 WSS utilities financed by the World Bank under the Second Urban Infrastructure Project (UIP2) providing WSS services from 50,000 to 4,000,000 customers, water losses might be closer to 45 percent.
High physical leakage and incomplete metering directly undermine utility financial recovery and energy resilience. Energy costs for Ukrainian WSS utilities typically account for more than 30 percent of their operational expenditures. Municipal and, in limited cases, oblast WSS utilities provide services to around 70 percent of the population in Ukraine, and since 2018 NEURC is no longer responsible for tariff approval for utilities serving fewer than 100,000 customers. Due to hostilities, only 65 % of consumers in Ukraine have access to water supply services and 49 % to wastewater systems, and on 21 August 2024 legislators adopted amendments to the Law of Ukraine ‘On Humanitarian Aid’ granting water supply and sewerage companies the right to receive humanitarian aid from donors.
Aligning municipal reconstruction with European Union accession and international financial institution covenants also introduces formal leakage benchmarking obligations. Member States shall ensure that an assessment of water leakage levels is performed using the infrastructural leakage index (ILI) rating method or another appropriate method covering water suppliers supplying at least 10 000 m3 per day or serving at least 50 000 people, communicated to the Commission by 12 January 2026 ahead of a delegated act by 12 January 2028. Every year, more than 32 billion cubic meters of treated water physically leak from urban water supply systems around the world, while 16 billion cubic meters are delivered to customers for zero revenue.
The IWA Water Balance Framework on Restored Ukrainian Networks
Auditing a pressurized distribution network starts with establishing an annual water balance that separates revenue-generating supply from physical leakage and commercial discrepancies. In the IWA water balance, Non-Revenue Water (NRW) equals System Input Volume minus Billed Authorised Consumption, assuming System Input Volume has been corrected for any known errors and the billed metered consumption period is consistent with the System Input Volume period. Non-Revenue Water (NRW) is the difference between System Input Volume and Billed Authorised Consumption and consists of Unbilled Authorised Consumption and Water Losses; Water Losses is the difference between System Input Volume and Authorised Consumption and consists of Commercial Losses and Physical Losses.
Each component of the annual water balance is bounded by strict operational definitions across transmission, storage, and customer service connections:
- Authorised Consumption is the annual volume of metered and non-metered water taken by registered customers, the water supplier, and others implicitly or explicitly authorised to do so (such as water used in government offices or fire hydrants), including exported water and leaks and overflows after the point of customer metering.
- Billed Authorised Consumption (Revenue Water) equals Billed Metered Consumption plus Billed Unmetered Consumption, whereas Unbilled Authorised Consumption equals Unbilled Metered Consumption plus Unbilled Unmetered Consumption (which includes fire fighting, flushing of mains and sewers, street cleaning, and frost protection).
- Commercial Losses (called Apparent Losses by the International Water Association) include customer metering inaccuracies, data handling errors in meter reading and billing, and unauthorised consumption such as illegal water withdrawal from hydrants for construction purposes, illegal connections, bypasses to consumption meters, or meter tampering.
- Physical Losses (called Real Losses by the International Water Association) are physical water losses from the pressurized system and the utility’s storage tanks up to the customer meter in metered systems or the first point of use (stop tap/tap) in unmetered situations, comprising Leakage on Transmission and/or Distribution Mains, Leakage and Overflows at Utility’s Storage Tanks, and Leakage on Service Connections up to point of Customer Metering.
| Water balance component | Revenue classification | Primary sub-components in municipal audits | Field verification mechanism |
|---|---|---|---|
| Billed Authorised Consumption | Revenue Water | Billed metered consumption and billed unmetered consumption across residential, commercial, and industrial accounts | Billing database reconciliation and customer meter register audits |
| Unbilled Authorised Consumption | Non-Revenue Water | Unbilled metered consumption and unbilled unmetered consumption for firefighting, mains flushing, sewer flushing, street cleaning, and frost protection | Operational logbooks, hydrant flow records, and utility facility sub-metering |
| Commercial Losses (Apparent Losses) | Non-Revenue Water | Customer metering inaccuracies, data handling errors in meter reading and billing, illegal hydrant withdrawal, unauthorized connections, meter bypasses, and tampering | Test-bench meter calibration, billing cadastre cross-checks, and service connection inspections |
| Physical Losses (Real Losses) | Non-Revenue Water | Leakage on transmission and distribution mains, leakage and overflows at utility storage tanks, and leakage on service connections up to the customer meter | District metered area inflow logging, night-flow decomposition, reservoir drop tests, and acoustic leak pinpointing |
Legacy municipal accounting terminology frequently obscures the boundary between authorized unbilled volumes and true distribution losses. Because of the widely varying interpretations and definitions of the term ‘Unaccounted for Water’, it is strongly recommended that this term no longer be used; it is equivalent to ‘Water Losses’ in the Water Balance diagram. In determining System Input Volume for the IWA water balance, utilities establish meter accuracy from manufacturers’ manuals (e.g. +/- 2%), correct System Input Volume for known errors, and apply 95% Confidence Limits, estimating any un-metered sources via temporary flow measurements, reservoir drop tests, or analysis of pump curves, pressures, and average pumping hours.
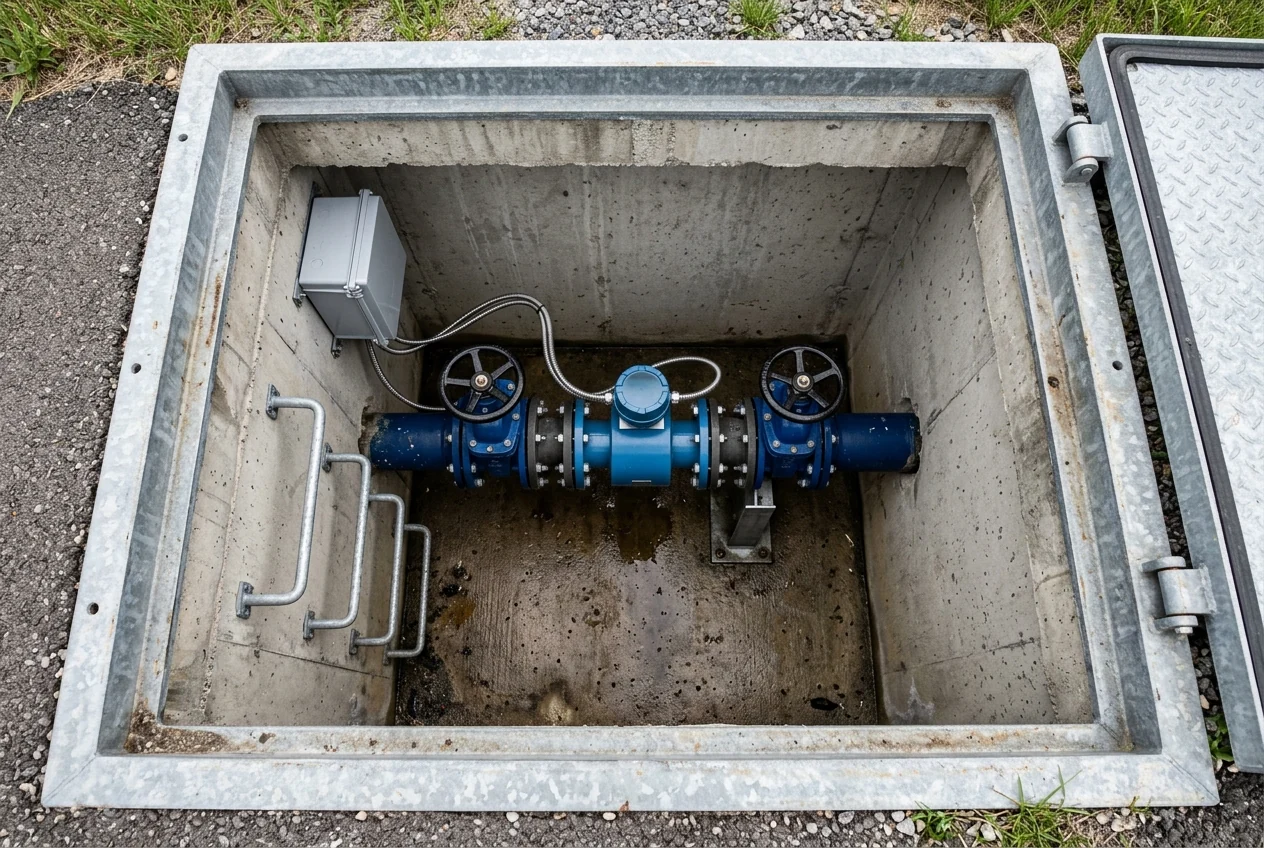 Underground concrete boundary chamber housing an inline electromagnetic flowmeter, twin flanged gate valves, and wall-mounted telemetry enclosure for continuous zone inflow monitoring.
Apparent Losses: Meter Under-Registration, Billing Gaps, and Unauthorized Consumption
Because physical leakage in top-down water audits is calculated as a residual after subtracting authorized consumption and commercial losses from system input volume, customer metering bias directly distorts the apparent scale of pipe leakage. In water audits, overregistration of customer meters leads to underregistration of Real Losses, whereas underregistration of customer meters leads to overestimation of Real Losses. Commercial (apparent) losses are best measured as a percentage of authorised consumption rather than water supplied, and the IWA Apparent Loss Index (ALI) uses a base value of 5% of water sales as a reference: Apparent Loss Index (ALI) = Apparent loss value ÷ 5% of water sales.
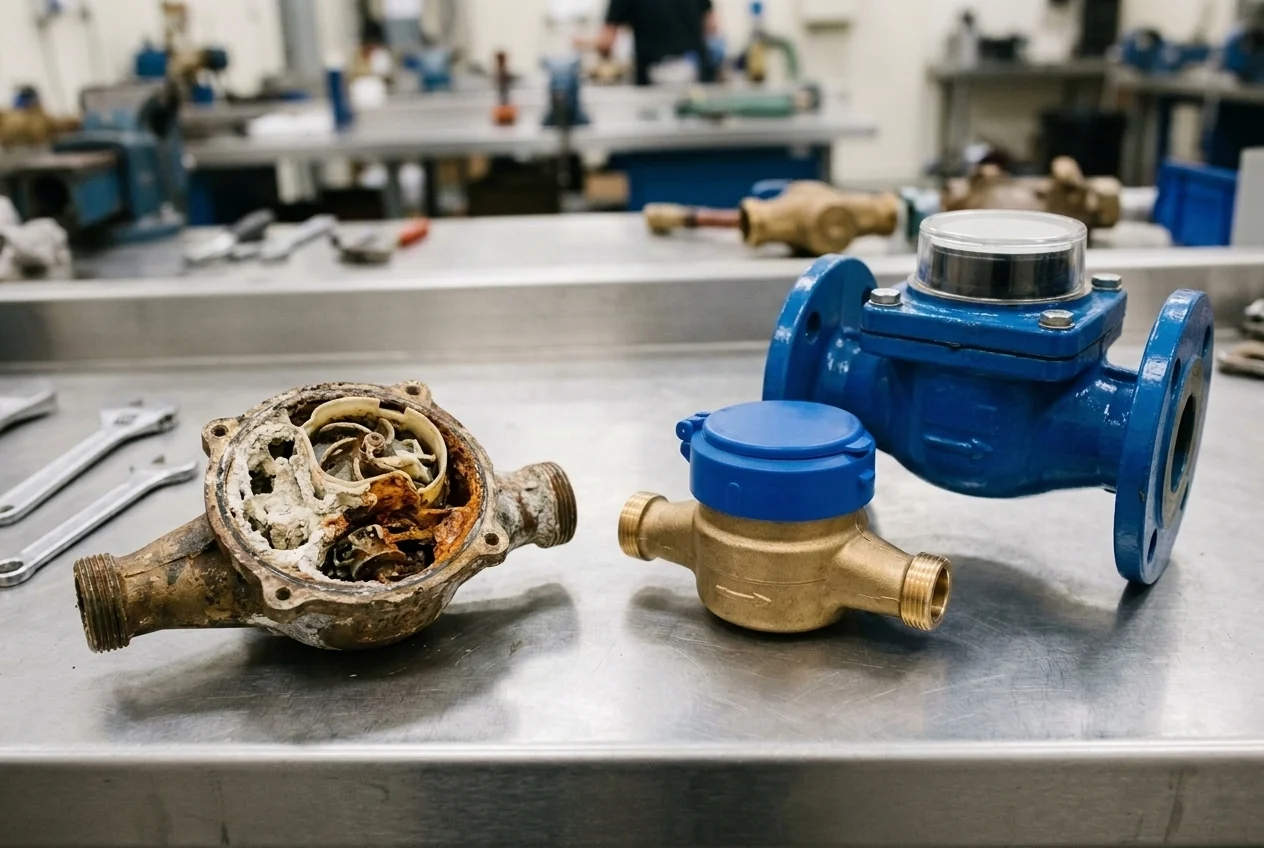
Evaluating customer and bulk meter error envelopes requires verifying flow-rate designations and in-service error limits across residential and industrial metering points:
- Under Clauses 4.1.1, 4.1.2, and 4.1.6, the flow rate characteristics of a water meter shall be defined by Q1 (minimum flow rate), Q2 (transitional flow rate), Q3 (permanent flow rate), and Q4 (overload flow rate); a water meter is designated by Q3 in m3/h and the ratio Q3/Q1, where the ratio Q2/Q1 shall be 1.6 and the ratio Q4/Q3 shall be 1.25.
- Under Clauses 4.2.2 and 4.2.3, for Accuracy class 1 water meters the Maximum Permissible Error (MPE) is ±1 % in the upper flow rate zone (Q2 ≤ Q ≤ Q4) for temperatures from 0.1 °C to 30 °C (±2 % above 30 °C) and ±3 % in the lower flow rate zone (Q1 ≤ Q < Q2); for Accuracy class 2 water meters the MPE is ±2 % in the upper flow rate zone (Q2 ≤ Q ≤ Q4) from 0.1 °C to 30 °C (±3 % above 30 °C) and ±5 % in the lower flow rate zone (Q1 ≤ Q < Q2).
- Under ISO 4064 / OIML R 49 Annex C, the maximum permissible errors (MPEs) of a water meter while in service should be twice the MPEs given in 4.2.2 or 4.2.3 according to the accuracy class of the meter.
Why Percentage NRW Fails on Post-Conflict and Intermittent Supply Networks
During post-conflict recovery, utilities frequently experience customer displacement, industrial demand shifts, and transitions from rationed hours to continuous pressurization, making simple percentage loss figures unreliable for engineering comparisons. Expressing NRW as a percentage of system input volume is misleading for assessing water losses because it does not indicate the ratio between physical and commercial losses, depends on network length and number of connections, and is highly dependent on supply time (intermittent supply), average operating pressure, and the level of consumption. If real losses average 100 litres/service connection/day, expressing real losses as a percentage of system input yields 29% for consumption of 250 litres/conn/d, 17% for consumption of 500 litres/conn/d, 9% for consumption of 1000 litres/conn/d, 2% for consumption of 5000 litres/conn/d, and 1% for consumption of 8000 litres/conn/d.
Empirical utility comparisons demonstrate how per-connection demand and supply duration distort percentage metrics:
- In System 1, a developed-country utility with a large proportion of condominium buildings reports only 13 percent NRW, yet its physical losses of 333 liters per connection per day at 50 meters pressure are fairly high by international standards and could be reduced by 200 liters per connection per day to save 30,000 cubic meters per day.
- In System 4 vs System 5, a network with intermittent supply (12 hours per day) has 20 percent NRW and physical losses of 300 liters per connection per day (when pressurized) at 15 meters pressure; when continuous supply is restored in System 5 without repairing leaks or changing pressure, the volume of physical losses doubles and NRW increases to 29 percent.
- In intermittent supply situations, 200 liters per connection per day in a system with only 12 hours of supply time equals 400 liters per connection per day in a continuous supply situation, so 400 liters per connection per day must be used as a performance indicator.
- Under the IWA performance indicator decision tree, if service connection density is less than 20 connections/km of mains, physical losses are expressed in litres per km pipe mains per day; where density is greater than 20 connections per kilometre of mains, the indicator is litres/service connection/day (or litres per connection per day per metre of pressure).
Real Losses, UARL, and the Infrastructure Leakage Index
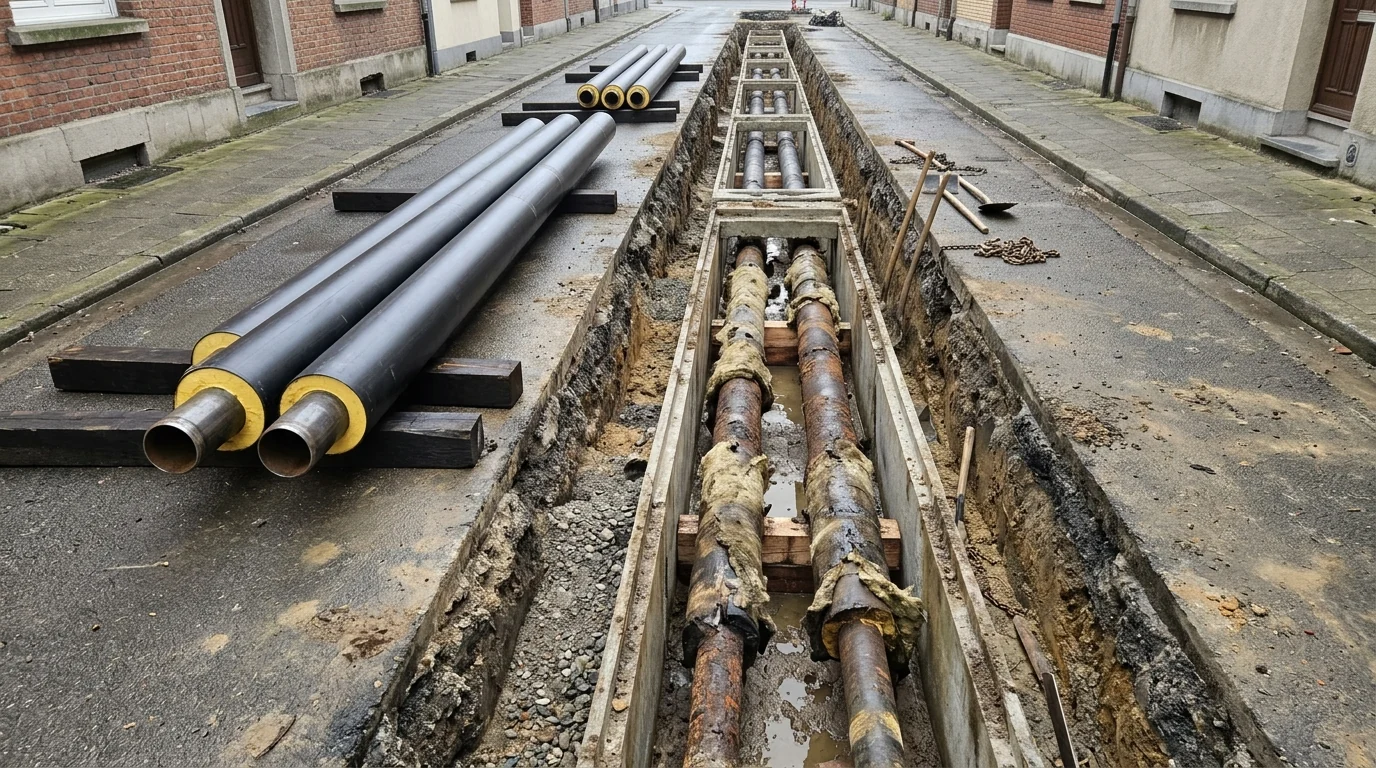
Even newly commissioned pipelines experience a baseline level of background seepage and occasional bursts, requiring engineers to benchmark current leakage against a theoretical unavoidable floor in the same disciplined manner used when evaluating buried thermal network repair versus replacement criteria. In its basic form, Unavoidable Annual Real Losses (UARL) in litres/day is UARL = (18 x Lm + 0.80 x Nc + 25 x Lp) x P, where Lm is mains length in km, Nc is number of service connections, Lp is total length in km of underground pipe between the edge of the street and customer meters, and P is average operating pressure in metres. In Table 4 (Calculated Components of Unavoidable Annual Real Losses UARL), the UARL coefficients per metre of pressure break down into background losses, reported bursts, and unreported bursts as follows: Mains = 9.6 + 5.8 + 2.6 = 18 litres/km mains/day/metre of pressure; Service Connections (meters at edge of street) = 0.60 + 0.04 + 0.16 = 0.80 litres/connection/day/metre of pressure; Underground pipes between edge of street and customer meters = 16.0 + 1.9 + 7.1 = 25 litres/km u.g. pipe/day/metre of pressure.
The empirical burst frequency, flow rate, and leak duration assumptions underlying those unavoidable loss coefficients are defined at reference operating pressure:
- At 50m reference pressure, Mains UARL assumes background losses of 20 litres/km/hr, reported bursts of 0.124 bursts/km/yr at 12 m3/hour for 3 days duration (107 m3/year per km mains = 293 litres/km/day at 50m pressure = 5.8 litres/km/day/m pressure), and unreported bursts of 0.006 bursts/km/yr at 6 m3/hr for 50 days duration.
- At 50m reference pressure, Service Connections to Edge of Street UARL assumes background losses of 1.25 litres/conn/hr, reported bursts of 2.25/ 1000 conns/yr at 1.6 m3/hour for 8 days duration, and unreported bursts of 0.75/1000 conns/yr at 1.6 m3/hour for 100 days duration.
- In the worked example of the IWA UARL paper, a distribution system with 1500 km mains and 60,000 service connections with customer meters located on average 6 metres from the edge of the street, pressurised for 90% of the time (0.9 x 365 days) at an average pressure of 30 metres, and current Annual Real Losses of 4000 x 10 3 m3/yr has a Technical Indicator for Real Losses (TIRL) of 202 litres/service connection/day w.s.p, UARL components of 266 (mains), 473 (connections to edge of street), and 87 (edge of street to customer meter) totaling 826 x 10 3 m3/yr (42 litres/service connection/day w.s.p), and an Infrastructure Leakage Index (ILI = TIRL / UARL) of 202/42 = 4.8.
Interpreting the dimensionless leakage index and selecting appropriate intervention thresholds depends on network size, operating pressure, and leakage duration:
- According to US EPA water audit guidance, the Infrastructure Leakage Index (ILI = CARL / UARL) has not yet been proven valid for small systems with average operating pressure less than 35 psi or where (Lm*32 + Nc) < 3,000 (where Lm is length of mains in miles and Nc is number of customer service connections); those systems should use the Real Losses performance indicator Op24.
- In Table 8.2 (World Bank Institute physical loss target matrix), Developed Countries are classified into Category A (ILI 1-2, Good), Category B (ILI 2-4, Potential for marked improvements), Category C (ILI 4-8, Poor), and Category D (ILI >8, Bad), whereas Developing Countries are classified into Category A (ILI 1-4), Category B (ILI 4-8), Category C (ILI 8 - 16), and Category D (ILI > 16).
- In Table 5 (Physical Loss Assessment Matrix), at 30 m average pressure, physical losses in liters/connection/day (when the system is pressurized) for Developed Countries are < 75 (Category A), 75–150 (Category B), 150–300 (Category C), and > 300 (Category D); at 30 m average pressure for Developing Countries, they are < 150 (Category A), 150–300 (Category B), 300–600 (Category C), and > 600 (Category D).
- In Figure 6.1 (Leak run time and volume of water loss), a reported mains burst at 75 m3/day lasting 1 Day loses 75 m3 and a reported service connection burst at 25 m3/day lasting 14 Days loses 350 m3, whereas an undetected service connection burst at 25 m3/day running for 365 Days loses >9,000 m3.
District Metered Areas, Minimum Night Flow, and Active Leak Detection
Translating a system-wide water balance into targeted pipe repairs requires partitioning the distribution grid into hydraulically isolated zones and integrating boundary metering chambers into donor-funded construction cost estimation and procurement packages. District Meter Areas (DMAs) are generally sized between 1,000 and 2,500 connections (or 1000-3000 properties); if the budget is limited, utilities can initially establish larger zones of 5,000 or more connections and subsequently subdivide them into DMAs and sub-DMAs of 1,000 or fewer connections (in Johor, Malaysia, Ranhill established 820 DMAs across 865,000 customers, averaging 1,055 customers per DMA). To verify hydraulic isolation of a DMA via a zero-pressure isolation test, utility managers (1) close all metered inlets and (2) check whether the water pressure within the DMA drops to zero; if the pressure does not drop to zero, another pipe is allowing water into the area.
Field implementation of boundary metering, night-flow decomposition, pressure modulation, and acoustic pinpointing follows specific hydraulic criteria:
- For a trial DMA, criteria include at least 500 connections, preferably 1 entry point where a meter can be installed and not more than 2 entry points, space to ensure 15 D before and after the meter, and flow logger data collection for at least 3 months.
- Global magnetic flowmeter sales reached $2.1 billion in 2025 and are projected to grow to more than $2.6 billion by 2030 (4.9 percent compound annual rate), driven by utilities swapping out 1960s–1990s mechanical meters for magnetic flowmeters that introduce no pressure drop to build District Metered Areas where up to 14% of treated water is lost.
- Within each DMA, Ranhill measures Legitimate Night Flow (LNF) across all non-domestic and 10% of all domestic meters for a two-hour period between 2:00 am and 4:00 am, calculating Net Night Flow as NNF = MNF - LNF and DMA commercial losses as Commercial loss = NRW - NNF.
- In pressure-leakage modeling, Leakage Rate L varies with Pressure^N1 according to L1/L0 = (P1/P0)^N1, where N1 factors range between 0.5 (corrosion holes only in metallic systems) and 1.5 with occasional values up to 2.5 (and N1=1.5 or higher for background leakage), while in distribution systems with a mix of pipe materials N1 values are in the order of 1 to 1.15.
- For DMA leak localization, acoustic noise loggers record noise at one-second intervals over two hours during the night, Step Testing uses successive temporary valve closures in a Leakage Control Zone of 500 to 1500 connections (and is not possible when a DMA has less than 500 connections or greater than 2,000 connections), and listening sticks, leak noise correlation, and ground microphones locate leaks to within 1 to 2 meters.
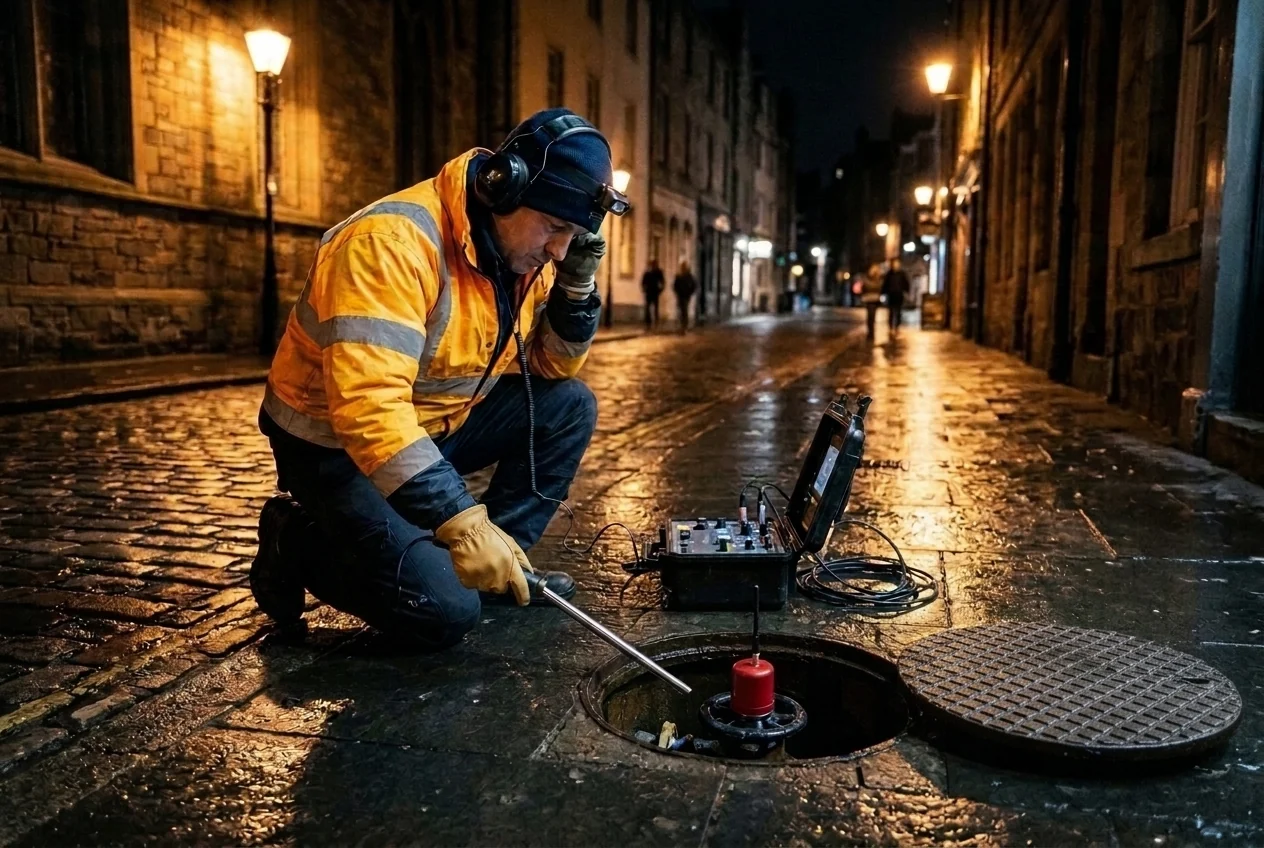 Night-time acoustic leak localization using a ground listening rod and magnetic valve-spindle noise logger during low-consumption hours.
Combining top-down water balance audits with bottom-up night-flow monitoring, pressure management, and acoustic leak pinpointing enables Ukrainian water utilities to prioritize capital rehabilitation where physical losses are highest while verifying post-restoration network integrity.
Sources
- World Bank Water Global Practice and Danube Water Program, Policies and Practices in Water Supply and Wastewater Sector in Ukraine
- European Investment Bank and European Union, Ukraine Recovery Programme Municipal Water Infrastructure Project Summary
- European Parliament and Council of the European Union, Recast Drinking Water Directive on the Quality of Water Intended for Human Consumption
- World Bank Institute, The Manager’s Non-Revenue Water Handbook: A Guide to Understanding Water Losses
- German Association for Water, Wastewater and Waste and Federal Ministry for the Environment, Water Loss Reduction in Drinking Water Supply Systems
- International Water Association Water Loss Task Force, Evaluating Water Losses and Unavoidable Annual Real Losses in Distribution Networks
- United States Environmental Protection Agency Office of Water, Water Audits and Water Loss Control for Public Water Systems
- International Organization for Standardization and International Organization of Legal Metrology, Water Meters for Cold Potable Water and Hot Water Metrological and Technical Requirements
- International Finance Corporation, Executive Case Study on Non-Revenue Water Reduction and District Metered Area Operations
- Flow Research Global Water Instrumentation Market Analysis, Magnetic Flowmeter Applications in Municipal Distribution Networks